Varslingsmodeller og skadeterskler
De ulike varslingsmodellene i VIPS presenterer varsler med informasjon om risiko for skader av en rekke skadegjørere i frukt og bær, og på jord- og hagebruksvekster. Disse reberegnes automatisk hver tredje time gjennom døgnet. I tillegg finner du her informasjon om aktuelle skadeterskler.
| Frukt og bær | Potet og grønnsaker | Korn og oljevekster | Diverse |
|
Liten og stor kålflue - observasjonsmodell i nyplantede felt |
|||
|
Liten og stor kålflue - observasjonsmodell i felt eldre enn 4 uker |
|||
|
|
|||
|
|
Frukt og bær
RIMpro (epleskurv)
RIMpro er et kombinert varslings- og simuleringsprogram for eple- og pæreskurv utviklet av Marc Trapman, Bio Fruit Advies, Nederland. Fra og med sesongen 2004 har RIMpro blitt lagt ut som nettapplikasjon med daglige automatiske oppdateringer av værdata og varsel.
Primære skurvinfeksjoner (forårsaket av askosporer)
Epleskurv overvintrer i første rekke som askosporer i gammelt bladverk på bakken. Sporene blir kastet i regn og kan infisere nye blad, skudd og frukter i tråd med forutsetninger i Mill's skurvtabell og modifiserte utgaver av denne. RIMpro bygger på dette og varsler den relative infeksjonsfaren (RIMverdi) for skurv og peker ut perioder med stor infeksjonsfare og perioder som er mindre risikofylt basert på en forventet normalfordeling i kastinga av askosporer. Desto flere sporer som er kastet og til lengre fuktighetsperioden er, desto høgere RIMverdi og følgelig større infeksjonsfare. Svært høge verdier, over 300, forekommer sjelden mer enn 2- 4 ganger pr. sesong, og disse bør alle sprøyte mot, selv i skurvsterke sorter. Merk ellers at enhver RIMverdi, vil kunne medføre infeksjonsfare dersom sorten er utsatt for skurv og smittepresset er stort.
Den absolutte infeksjonsfaren under en infeksjonsperiode er ikke bare avhengig av RIMverdi, men også smittepress, sort og vekstnivået i frukthagen. Til sammen utgjør disse faktorene den samla infeksjonsfaren og avgjør hvilken strategi som bør settes inn mot skurv (se tabell 2 og 3). Nedbør, temperatur, sollys og tilvekst etter sprøyting er viktige faktorer som påvirker nedbryting og fortynning av plantevernmidler. Disse elementene må også vurderes før ny sprøyting settes inn.
Eplevikler - tradisjonell varslingsmodell
Den tradisjonelle modellen kombinerer overvåkingsfeller og døgngrader. Fare for epleviklerangrep oppstår når følgende tre kriterier er oppfylt samtidig:
- Epletrærne har nådd et utviklingsstadium som kan gi god overlevelse for eplevikleregg, dvs tidligst ved 90-95% kronbladfall
- Det er påvist betydelig sverming av epleviklerhanner, dvs ukentlig fangst per oppsatt epleviklerfelle er større enn 10-20 individer (se meldinger i VIPS eller ha egen felle)
- Det har vært varmt nok til at eplevikleren har lagt egg (minst 14 grader ved solnedgang) i minst tre av dagene for den ukentlige fangsten i punkt 2.
Vi kan også legge til et fjerde kriterium, nemlig at det var angrep av eplevikler i hagen det foregående år.
Så snart alle disse kriteriene er oppfylt, vil hunnene begynne å legge egg. Forventet start for klekking av eggene er etter 90 graddager (med basistemperatur 10).
Når startdato for egglegging er anslått, kan tidspunkt for klekking beregnes her...
Norsk Landbruksrådgivning gir lokaltilpassede råd om tiltak. I VIPS følger vi med på fangst i ca. 15 observasjonsfeller fra midten av mai til begynnelsen av juli. Fangstene legges ut under Meldinger i VIPS hver fredag. Men både bestand av eplevikler og værforhold kan variere mye fra hage til hage, og varslene basert på fellestasjonene i VIPS vil ha størst gyldighet helt lokalt. Epledyrkere som har årlig skade av eplevikler anbefales derfor sterkt å henge opp feller i egen hage.
Eplevikler i RIMpro
(Supplerende modell som har vært tilgjengelig fra 2009)
Ulempen med den tradisjonelle modellen er at den krever feller, og at fellene bare fanger hanner. Egg legges jo av hunnene, og sammenhengen mellom mengde hanner i fellene og skade i frukten er ikke alltid veldig god. Marc Trapman i Bio Fruit Advies i Holland utviklet et kombinert varslings- og simuleringsprogram for eplevikler som kalles RIMpro Cydia, og dette er tilgjengelig i VIPS. I RIMpro Cydia har Trapman lagt inn all kjent informasjon om hvordan hunnene av eplevikler påvirkes av temperatur og nedbør helt fra larvestadiet. RIMpro Cydia i VIPS bruker værdata (både historiske og varsler), men ikke observasjoner fra felt. RIMpro-varsler for eplevikler finner du her.
Lenger sør i Europa har eplevikler mye større bestander enn i Norge, og RIMpro Cydia har der vist seg vel så brukbar som tradisjonell fellefangst. Men det er flere grunner til at det tradisjonelle overvåkingssystemet med faktiske observasjoner i hagen ikke bør forlates i Norge: Den viktigste er at RIMpro Cydia ikke vet om det faktisk er eplevikler til stede i en hage. Til det trengs det feller. I VIPS kan man f.eks via kartet på forsiden få opp RIMpro Cydia for stasjoner i Hardanger, som tilsynelatende viser når eplevikler legger egg der. Men eplevikler forekommer enn så lenge ikke i Hardanger. Dette vet ikke RIMpro-modellen. En annen sak, som ble veldig aktuell i 2018, er at vi ikke vet hvordan vi skal stille inn RIMpro for få riktig bilde av en evt generasjon nr 2 for norske epleviklere.
RIMpro for eplevikler finner du her.. Du kan også velge RIMpro direkte fra menyen på forsiden til VIPS. I tabellen du kommer til, er bare værstasjoner i områder med kjent forekomst av eplevikler tatt med. Etter valg av værstasjon, vil du få opp tre figurer som viser den relative mengden av henholdsvis hunner (blå figur), egg (gul) og små larver (rød). Om disse figurene er riktig beregnet, gir de et meget godt grunnlag for å velge rett sprøytetidspunkt. For å sjekke om modellen gir et riktig bilde av forholdene i din hage, kan du se om start og topp for fellefangst av hanner i hagen stemmer nogenlunde overens med RIMpro-figuren som viser hunnenes flygeaktivitet (nederste figur, blå stolper). En til to ukers avvik kan forventes (særlig i kaldt vær), siden hannene er tidligere på vingene enn hunnene. Men er det flere ukers avvik, bør du si fra til lokal rådgiver og være skeptisk til RIMpro-figurene. Når du sammenligner hannfangst og RIMpro, husk at fellefangstene kan ha skjedd opptil en uke før datoen for opptelling (dersom fellen sjekkes en gang per uke).
Se mer om epleviklervarsling her... Kommentarer kan sendes forsker Nina Trandem
Rognebærmøll
Kontaktperson: Gunnhild Jaastad gunnhild.jaastad@nibio.no
Varslingsmodell
Varsling av rognebærmøll er eit samarbeid mellom lokale rådgjevarar i fruktdistrikta og NIBIO. I august tel rådgjevarane kor mykje bærklasar det er på utvalde referansetre i utvalde område (prognosestasjonar) og haustar samstundes ei bærprøve som vert sendt til NIBIO. Frå denne bærprøven finn vi angrepsgrad av rognebærmøll for kvar prognosestasjon. Det vert også rekna andel parasitterte rognebærmøllarver. Våren etter tel dei lokale rådgjevarane blomeklasar på dei same referansetrea og vi kan rekne ut varselet.
Er det nok blomeklasar på våren i høve til talet møll som overvintrar, vil rognebærmøllen halde seg til rogn. Berre om det er for lite bær på rogna angrip møllen eple. Varsel om fare for angrep finn du her.
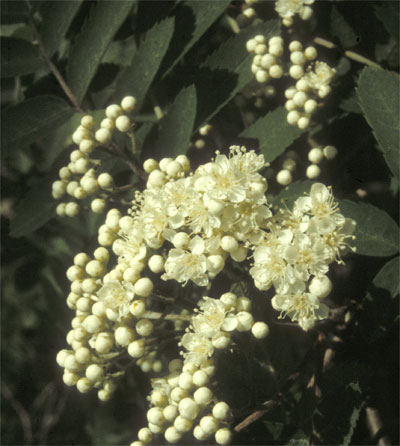
Utviklingstrinn for rognebærmøll
Fordi utviklinga til rognebærmøll er avhengig av temperatur, kan utviklingsfarten variere mellom ulike distrikt. Tidspunktet for dei ulike utviklingstrinna kan reknast ut frå varmesum (akkumulerte graddagar (døgngrader, dg)) etter full blom i rogn
Full blom i rogn er definert som: 50 % av klasen er dekka med opne blomar (BILETE). Full blom må du vurdere sjølv, og ha notert dato for.
Utrekning av døgngrader finn du på same side som varsel for angrep av rognebærmøll.
Slik går du fram:
- Velg værstasjonen som ligg nærast eplehagen din
- Tast inn dato for full blom
- Velg sluttdato, inntil 9 døgn fram i tid
- Trykk "beregn"
- Du får no fram talet døgngrader frå oppgitt dato for full blom vist i ein graf.
Utviklingstrinna for rognebærmøll:
- 174 dg (døgngrader) etter full blom startar sverming
- 320 dg (døgngrader) etter full blom startar egglegging
- 556 dg (døgngrader) etter full blom klekker dei fyrste egga
Tidspunkt for tiltak
Dersom det er varsla fare for angrep i ditt distrikt og du vil setje inn tiltak, er det viktig å setje inn tiltaket til rett tid. Rett tidspunkt er avhengig av kva tiltak som skal nyttast. Til dømes må tiltak mot egg skje mellom 320 dg og 556 dg, og tiltak mot nyklekte larver etter 556 dg.
Sjå meldingar om rognebærmøll nederst på siden her.
Gråskimmel i jordbær
Kontaktperson: Arne Stensvand arne.stensvand@nibio.no
Varsling av gråskimmel i jordbær
Værstasjoner som er med i gråskimmelvarslingen i VIPS: Brunlanes, Gjerpen, Gvarv, Hjelmeland, Kise, Kvam, Landvik, Lier, Linge, Ljøsne, Lyngdal, Mære, Ornes, Ramnes, Særheim, Sandane, Skjetlein, Skogmo, Tingvoll og Ås.
Modellbeskrivelse
Primærinfeksjonene for soppsjukdommen gråskimmel (Botrytis spp.) i jordbær skjer under fuktige forhold gjennom de åpne blomstene. Soppen vokser inn i blomsten og vil enten drepe denne, eller så ligger soppen latent og vil kunne bryte ut på bærene under kartutviklingen. Ved optimale temperaturforhold (15 - 20°C) tar det 10 – 11 timer med fuktighet for å infisere blomstene. Ved høyere og lavere temperaturer tar det lengre tid for å få infeksjon.
Grunnmodellen som brukes, ble opprinnelig utviklet i Ohio i USA og inkluderer måling av temperatur og bladfuktighet (Bulger et al. 1987). Senere ble modellen videreutviklet i Florida ved å legge til modeller som påvirker opptørking i jordbærfeltene (MacKenzie og Peres 2012, Montone et al. 2014). Disse tilleggsmodellene er basert på måling av relativ luftfuktighet, vind og globalstråling. I Florida kalles varslingssystemet ‘Strawberry Advisory System’ (SAS).
Alle klimastasjonene vi bruker, måler temperatur, bladfuktighet og relativ luftfuktighet, og mange har også utstyr for vindmåling og globalstråling. Alt etter hvilket utstyr stasjonene har, legges det til modeller som beskriver fuktigheten i plantebestandene. Dette gjøres automatisk.
Både grunnmodellen fra Ohio og den senere justerte modellen fra Florida har vært prøvd i Norge (Eikemo et al. 2010, 2013, Stensvand et al. 2021, 2022). Resultatene har vist at det gis gode estimat av forholdene for infeksjon i norske jordbærfelt.
Tolking av varsel
En heltrukken svart linje viser infeksjonsfaren over tid. Lav risiko (grønn bakgrunn) og moderat risiko (gul bakgrunn) gir ikke infeksjonsfare, men hvis linjen passerer høy risiko (rød bakgrunn), har det vært fare for infeksjon, og tiltak må vurderes. Til høyre for den vertikale stiplede linjen merket «Forecast», er infeksjonsfaren estimert basert på 48-timers værvarsel.
Eksempel:
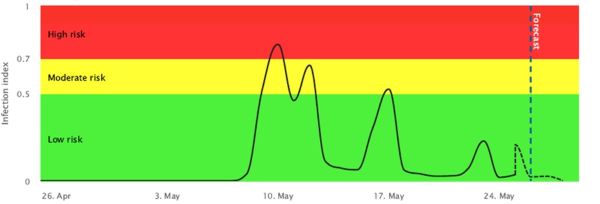
Varsel av gråskimmel på Ås i mai 2021. Til høyre for den stipla loddrette linja er infeksjonsfare 48 timar fram i tid estimert av værdata fra Meteorologisk institutt. Til venstre er forholdene som har vært, med et varsel (‘High risk’, rødt) rundt 9. - 10. mai. ‘Low risk’ (grønt) og ‘Moderate risk’ (gult) gir ikke grunnlag for behandling
Referanser
Bulger, M.A., Ellis, M.A. og Madden, L.V. 1987. Influence of temperature and wetness duration on infection of strawberry flowers by Botrytis cinerea and disease incidence of fruit originating from infected flowers. Phytopathology 77:1225–1230.
Eikemo, H., Stensvand, A., Linge, N.E. og Christensen, D. 2010. Vurdering av to modellar for varsling av gråskimmel i jordbær. Norsk Frukt og Bær 13 (1):28-30.
Eikemo, H., Strømeng, G.M. og Stensvand, A. 2013. Evaluation of two models to predict grey mould in strawberry. European Journal of Horticultural Science 78:40–4626.
MacKenzie, S.J. og Peres, N.A. 2012. Use of leaf wetness and temperature to time fungicide applications to control Botrytis fruit rot of strawberry in Florida. Plant Disease 96:529–536
Montone, V.O., Fraisse, C.W., Peres, N.A., Sentelhas, P.C., Gleason, M., Ellis, M. og Schnabel, G. 2014. Evaluation of leaf wetness duration models for operational use in strawberry disease-warning systems in four US states. International Journal of Biometeorology 60:1761-1774
Stensvand, A., Vereide, R., Hauso, I. og Østensen, I.R. 2021. Varsling av gråskimmel i jordbær. Norsk Frukt og Bær 24 (2):10-11.
Stensvand, A., Skog. T.-E., Vereide, R., Hauso, I. & Østensen, I.R. 2022. Varsling av gråskimmel i jordbær gjennom ”Strawberry Advisory System”. Norsk Frukt og Bær 25 (2):6-7.
Potetsikade
Kontaktperson: Annette Folkedal Schjøll annette.folkedal.schjoll@nibio.no
Det er utarbeidet en bekjempingsterskel for potetsikade som kan brukes av den enkelte potetdyrker. Terskelverdien baserer seg på at det gjøres en opptelling i åkeren i juni mens plantene er relativt små, og ut fra hvor mye potetsikade det er i åkeren anbefales det å bekjempe eller ikke bekjempe sikadene.
Opptelling av potetsikadeangrepet
Antall voksne sikader skal telles opp på minst 10 planter spredt rundt i åkeren. Opptellingen på den enkelte plante gjøres som følger: Tre en gjennomsiktig plastpose på størrelse med en søppelpose over en enkelt plante. Det er viktig at dette gjøres raskt når en kommer fram til planten, ellers vil lett noen sikader fly vekk. Det er også viktig at plastposen føres helt ned til jorda rundt planten. Potetplanten ristes deretter kraftig inne i posen. De fleste sikadene vil da fly av planten og havne i plastposen. Posen løftes så opp over planten og lukkes helt igjen. Planten må ikke nødvendigvis løsnes fra jorda for å ristes, men det kan være en fordel å gjøre det dersom planten er forholdsvis stor.
Deretter teller en opp hvor mange voksne, lysegrønne sikader som er i posen. Dersom det er mye lys blir opptellingen enklest ved at en gir sikadene et par minutter til å bevege seg til toppen av plastposen (de beveger seg mot lyset). Dersom det er vått og lite lys blir opptellingen enklest dersom en legger posen på bakken så de lysegrønne sikadene ses mot den mørke jorda. Noter antall sikader i plastposen og gjenta prosedyren på til sammen 10 planter. Summer antall voksne sikader som befinner seg på de 10 plantene.
Bekjempingsterskel for potetsikade
Det bør bekjempes med et skadedyrmiddel dersom det er mer enn 20 sikader på 10 planter, altså hvis det i gjennomsnitt er mer enn 2 voksne sikader per potetplante i juni.
Korn og oljevekster
Brukerveiledning for varslingsmodeller
Blomstringsmodell i havre er utviklet av Anne-Grete Roer Hjelkrem, mens de øvrige modellene er utviklet av Oleif Elen.
Varsel for sjukdommer beregnes ut fra informasjon om været, art/sort, dyrkingsforhold og eventuelle angrep ute i åkeren. Ved å skrive inn en del informasjon om egen åker (åkre/felter) kan du her beregne varsel om fare for angrep. For byggbrunflekk er det nødvendig at du har gjort noen opptellinger av angrep ute i åkeren (se skjema ) og veiledning før du starter varselberegning. For de andre sjukdommene beregnes varsel ut fra dyrkingsforhold og værdata.
Før du starter, kan det være greit å ha tilgjengelig informasjon om aktuell kornart/sort, sådato, fjorårets kultur, eventuell dato for pløying for aktuelle åkre/felter. Du trenger også å vite hvilken værstasjon som er aktuell for deg.
Ved seinere varselberegninger kan det være aktuelt å legge inn informasjon om sprøyting mot sopp (dato for sprøyting, hvilket preparat, dosering og på hvilket stadium sprøyting er utført).
| Kultur | Sjukdom | Informasjon som er grunnlaget for beregning av varsel |
|---|---|---|
| Vårhvete | Bladflekksjukdommer | Lokale værdata, sådato, sort, forgrøde |
| Vårhvete | Mjøldogg (under uttesting) | Lokale værdata, sådato, sort, antall angrepne blad |
| Høsthvete | Bladflekksjukdommer | Lokale værdata, sådato, sort, forgrøde |
| Høsthvete | Mjøldogg (under uttesting) | Lokale værdata, sådato, sort |
| Bygg | Byggbrunflekk | Lokale værdata, sådato, sort, antall angrepne blad |
| Havre | Blomstringsmodell for DON i havre | Lokale værdata, sådato |
Blomstringsmodell i havre
Kontaktperson: Ingerd Skow Hofgaard ingerd.hofgaard@nibio.no
I de senere år er det registrert en økende forekomst av deoxynivalenol (DON) i norskprodusert korn. Dette mykotoksinet (soppgift) produseres av Fusarium graminearum og Fusarium culmorum - sopper som forårsaker kornsjukdommen «aksfusariose». Risikoen for aksfusariose og utvikling av DON i korn øker særlig ved fuktig vær i kornplantenes blomstringsperiode (se tabellen nedenfor).
Fungicid-behandling under blomstring av kornet har vist seg i gjennomsnitt å halvere forekomsten av DON i høsta korn. I Norge er Proline og Delaro (virksomt stoff protiokonazol) godkjent brukt til bekjemping av aksfusariose i korn.
Aksfusariose- beregning av blomstring i havre
([Aksfusariose.gif], kommer snart)
Tabellen viser antatt risiko for utvikling av deoxynivalenol (DON) i korn. OBS! Mais som forgrøde gir betydelig økt risiko. Tabellen er hentet fra Bioforsk TEMA nr 5 2013.
NIBIO ønsker å kartlegge hvilke vær- og dyrkingsforhold som øker risikoen for utvikling av mykotoksiner i korn. For å kunne gjennomføre dette har vi behov for et stort datagrunnlag. Vi setter derfor stor pris på om havre og hvetedyrkere kan registrere dyrkingsopplysninger for innleverte kornpartier (korndata.no)
Byggbrunflekk
Kontaktperson: Andrea Ficke andrea.ficke@nibio.no
Varslingsmodellen
Varslingsmodellen lager en tilvekstkurve for byggbrunflekk med meteorologiske data som grunnlag og det er nødvendig å legge inn data for angrep av sjukdommen for at varselet skal beregnes (telle opp hvor mange blad av 100 som har byggbrunflekk). Dessuten tar modellen hensyn til sådato, sort, vekstskifte og jordarbeiding. For hver dag øker sjukdommen noe, avhengig av nedbørsmengde og - hyppighet.
Varslingsmodellen blir hver dag sammenliknet med en terskelverdi som også vokser fra dag til dag. Dersom den observerte eller varslede sjukdomsverdien er større enn terskelverdien, blir det gitt varsel om at sprøyting med et soppmiddel bør vurderes. Terskelverdien gir et uttrykk for om det økonomisk vil lønne seg å sprøyte og er beregnet på grunnlag av avlingstap pga. sjukdom og gjennomsnittlige sprøytekostnader.
Tolking av varsel
Varslene vises som diagram og som tabell. Svart linje viser beregnet sjukdomsverdi og rød linje viser økonomisk skadeterskel. Prikkede linjer er beregnet etter værprognoser. Når den svarte linjen krysser den røde og blir liggende over denne, bør behandling med soppmiddel vurderes. I tabellen som ligger nedenfor diagrammet er det samme framstilt på en annen måte. Grønne ruter viser at forventet angrep er mindre enn terskel. Når ruta er rød bør sprøyting med soppmiddel vurderes.
Tabellen med detaljerte varsler har disse kolonneoverskrifter med følgende betydning:
Dato og tid: - Dag og tidspunkt
Antall angr.bl.: - Antall sjuke blad av 100, beregnet verdi
Terske antall angr. blad: - Beregnet terskelverdi som antall sjuke blad av 100
%Angr. Bladareal: - Beregnet sjukdomsangrep som % bladareal
Terskel, %angr. bladareal: - Terskel beregnet som % bladareal
Status: - Varselsymbol for infeksjonsfare
Les mer om byggbrunflekk i Plantevernleksikonet
Skadedyr i korn og oljevekster
Rapsglansbille
Kontaktperson: Annette Folkedal Schjøll annette.folkedal.schjoll@nibio.no
Ansvarlig for resistensvarsel: Nina Svae Johansen nina.johansen@nibio.no
Om rapsglansbille
Les mer om rapsglansbille i Plantevernleksikonet. og i artikkelen Informasjon om resistens hos rapsglansbiller og råd om sprøyting i vekstsesongen 2021.
Resultater fra tidligere års resistensvarsler finner du her: 2011, 2012, 2013, 2014, 2015, 2016, 2018, 2019
Skadeterskel - registrering av rapsglansbille i åker
Ved å registrere antall rapsglansbiller i åkeren ved forskjellige utviklingsstadier av kulturen, er det mulig å vurdere bekjempelsesbehovet. Ofte er det mest biller i kanten av åkeren, så sjekk også plantene innover i åkeren. Du kan gjøre opptellingen slik: Tell opp biller på minst 50 tilfeldig fordelte planter. Ta første opptelling i kanten av åkeren. Gå deretter i en rett linje innover i feltet. Stopp med 10 meters mellomrom og plukk 5 planter ved hvert stopp. Hvis du rister plantene over en lys plastboks eller liknende er det lett å telle opp antall biller.
Følgende skadeterskel brukes:
| Plantestadium | Antall rapsglansbiller |
|---|---|
| Tidlig knoppstadium | 0,5-1,0 i gjennomsnitt per plante |
| Middels tidlig knoppstadium | 1-2 i gjennomsnitt per plante |
| Sent knoppstadium | 2-3 i gjennomsnitt per plante |
Havrebladminerflue
Kontaktperson: Annette Folkedal Schjøll annette.folkedal.schjoll@nibio.no
Les mer om havrebladminerflue i Plantevernleksikonet.
Registrering av skade i åker
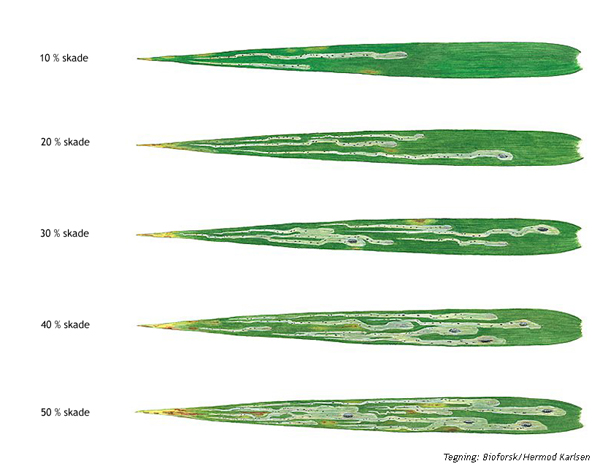
Tegningen nedenfor viser 10%, 20%, 30%, 40% og 50% skade på havreblad forårsaket av havrebladminerflue.

Kornbladlus
Kontaktperson: Annette Folkedal Schjøll annette.folkedal.schjoll@nibio.no
Om bladlus
Bladlus er små insekter med eggformet kropp, tynne bein og to rørlignende utvekster (kalt ryggrør) på ryggsiden av bakkroppen. Det forekommer både vingete og uvingete individer. På korn er det først og fremst havrebladlus og kornbladlus som har økonomisk betydning. Begge artene er utbredt over hele landet. Mer informasjon finner du i Plantevernleksikonet.
Skadeterskel - registrering av kornbladlus i åker
Ved å registrere antall kornbladlus i åkeren ved forskjellige utviklingsstadier av kornet, er det mulig å vurdere bekjempelsesbehovet. I praksis foregår dette ved registrering av antall kornbladlus på plantene i en diagonal over feltet (100 m). Man teller antall bladlus per plante, eller observerer om det er kornbladlus eller ikke, på 100 planter eller strå fordelt på 20 steder. Det registrerte antallet kornbladlus sier noe om faren for skade i kornåkeren og behovet for bekjempelse. Følgende skadeterskel brukes:
| Plantestadium | Antall kornbladlus |
|---|---|
| Ved skyting | Mer enn 3 bladlus per strå eller 60 % av stråene med bladlus |
| Ved avsluttet blomstring | 10 bladlus per strå eller 90 % av stråene med bladlus |
| På melkestadiet | 15 bladlus per strå eller 95 % av stråene med bladlus |
| Bare de bladlusene som sitter på flaggbladet og i akset regnes med | |
Havrebladlus
Kontaktperson: Annette Folkedal Schjøll annette.folkedal.schjoll@nibio.no
Skadeterskel - eggregistrering på hegg om våren
Havrebladlus har tvungent vertskifte mellom hegg som vintervert, og korn og gras som sommerverter. Ved å registrere bladlusegg på hegg, er det mulig å gi en prognose for angrep av bladlus i kornåkre kommende sesong. I praksis foregår dette ved at egg på knopper/innsamlede kvister telles. Det registrerte antallet egg gir indikasjon på mengden bladlus i området kommende sesong, og dermed faren for skader i kornåkre. Følgende skadeterskel brukes:
| Antall egg pr 10 knopper | Fare for skader på grunn av havrebladlus |
|---|---|
| 0-1 egg | liten fare |
| 2-5 egg | middels fare |
| Mer enn 5 egg | stor fare |
Offentlig utarbeiding av prognoser utføres ikke lenger. Det er mulig å gjøre egne registreringer dersom man har en egnet lupe og kjenner til hvordan bladluseggene ser ut.
Resultater fra tidligere års tellinger finner du her: 2019 2018 2017 2016 2015 2014 2013 2012
Skadeterskel - registrering av havrebladlus i åker
Ved å registrere antall havrebladlus i åkeren ved forskjellige utviklingsstadier av kornet, er det mulig å vurdere bekjempelsesbehovet. I praksis foregår dette ved registrering av antall havrebladlus på plantene i en diagonal over feltet (100 m). Man teller antall bladlus per plante, eller observerer om det er havrebladlus eller ikke på 100 planter eller strå fordelt på 20 steder. Det registrerte antallet havrebladlus sier noe om faren for skade i kornåkeren og behovet for bekjempelse. Følgende skadeterskel brukes:
| Plantestadium | Antall havrebladlus |
|---|---|
| Busking | Mer enn 5 bladlus per strå eller 60 % av stråene med bladlus |
| Skyting | 10 bladlus per strå eller 85 % av stråene med bladlus |
| 1-2 uker etter skyting | 15 bladlus per strå eller 95 % av stråene med bladlus |
| Bladlus på hele planten regnes med. Dette er spesielt viktig på buskingsstadiet - sjekk helt nederst på planten! |
Ugras i korn
VIPS-Ugras 2.0 er en ny versjon av VIPS-ugras. IPM Consult har utviklet systemet og som på dansk heter IPMwise. Det er tilpasset norske forhold av Norsk institutt for bioøkonomi (NIBIO) i samarbeid med Norsk Landbruksrådgiving (NLR). Det er nye beregninger og tilpasninger, men det er mye det samme innholdet som gamle VIPS-Ugras. VIPS-Ugras 2.0 krever innlogging. Fordelen med innlogging er at systemet kan huske skiftene dine. Systemet inngår som en del av VIPS og er gratis i Norge. Du kan velge å bruke ferdig innlagte effektkrav eller velge dine egne effektkrav. For en optimal plantevernløsning for de fleste forhold anbefaler vi at du bruker systemets effektkrav.
Applikasjonen startes her ..
Brukerveiledninger og skjemaer
Innsamling av feltopplysninger
Registrering av feltopplysninger
Brukerveiledning for tiltak mot frøugras vår/forsommer
Brukerveiledning for bruk av glyfosat i stubb
|
Kontaktpersoner: |
Kirsten Tørresen kirsten.torresen@nibio.no |
|
|
Modell for avling og fôrkvalitet i eng
Startside for beregning av modellen
Bruksområde
Modellen skal underveis i vekstsesongen gi støtte for valg av høstetid i to- og treslåttsystem i eng som brukes til fôrproduksjon. Den er utvikla på grunnlag av data fra timoteidominert eng, men kan også brukes på bestand dominert av fleirårig raigras.
Modellen kjøres mot data fra værstasjonene til Landbruksmeteorologisk Tjeneste (LMT), og vil bare kunne gi prediksjoner for utvikling i avling og kvalitet i områder som dekkes av disse.
Oppbygging og prinsipp i modellen
Modellen rekner ut fortløpende dagverdier for avling, fenologisk utvikling, fiberinnhold i avlinga (NDF og ufordøyelig NDF i tørrstoff), energikonsentrasjon i avlinga (fôrenheter melk, FEm, i tørrstoff) og nitrogen-/proteininnhold i avlinga (råprotein i tørrstoff).
Avlingsfunksjonen starter ved vekststart om våren. Dato for vekststart blir bestemt ut fra luft- og jordtemperatur. Vekststart inntreffer når det etter 1. mars, eller den dato som bruker sjøl velger, har vært tre påfølgende femdøgnsmiddel for lufttemperatur høgere enn 5 °C med en samtidig middel jordtemperatur (10 cm) for dette tidsintervallet høgere enn 1°C. Enkelte av LMT sine stasjoner har ikke registrering av jordtemperatur, og da er det kun lufttemperaturen som bestemmer dato for vekststart. Når kravene som er beskrevet over er innfridd etter valgte dato, startes veksten. Avlingsfunksjonen rekner ut daglige tilvekster ut fra en potensiell tilvekst justert til en reell tilvekst på grunnlag av værdata, engas fenologiske utviklingstrinn ("alder") og antakelser om vannlagringevnen i jorda der enga ligger. Justeringene skjer ved hjelp av fire indekser som hver kan ha verdier fra 0 til 1 og er uttrykk for på forutgående dags målte stråling, temperatur, vanntilgang og engas fenologisk alder.
Til funksjonene som rekner ut avling, fenologisk utvikling og fôrkvalitet, hører noen parametre som er faste og noen som kan tilpasses til enga det kjøres simuleringer for. Tilpassinga skjer på grunnlag av registreringer som bruker gjør og sjøl legger inn via brukergrensesnittet. Funksjonene blir ved hjelp av optimeringsrutiner tilpasset eller kalibrert til de lokale forholdene og deretter brukt i videre framskrivinger.
Modellen kan kjøres både med og uten lokale kalibreringer.
Inndata og valg som gjøres av bruker
Fra en meny velger bruker en værstasjon som modellen skal kommunisere mot. Videre skal en spesifisere jordtypen enga ligger på og hvor mye kløver den inneholder. Jordtypen har konsekvenser for hvor mye plantetilgjengelig vatn det forutsettes å være i sesongen, og kløverinnholdet påvirker utviklingsforløpet for fiberinnholdet i avlinga.
For klimatasjonene på NIBIO-enhetene og på Ås kan normaler for perioden 1991-2020 hentes og brukes som inngangsdata for prediksjonene. Bruker får da opp normalkurver i samme diagram som prediksjoner basert på værdata for enkeltår. Det er også mulig å kjøre modellen utelukkende på normaldata.
Modellen kan ta hensyn til at det i en del strøk brukes kunstig vatning underveis i sesongen. Bruker kan legge inn hvilke datoer det vatnes og hvor mye det vatnes hver gang. Dette påvirker da estimatene for vanntilgang og vekst.
Videre går modellen framover i tid fra dags dato og 9 døgn framover på værprognoser fra Meteorologisk institutt. Sjølvalgte værscenarier kan brukes for tida som kommer etter de 9 døgnene som prognosene dekker. Scenariene bygges opp som kombinasjoner av temperatur, nedbør og globalstråling fra en meny i brukergrensesnittet.
Modellen kan også kjøres på værdata for tidligere vekstsesonger som automatisk hentes inn når en legger inn ønska år i cellene for høstedato. Det er begrensninger på hvor langt tilbake i tid og hvilke stasjoner det finnes data for.
For kalibrering av modellen kan en også legge inn egne, lokale målinger og analyser av engas høyde, fenologiske utviklingstrinn og fôrkvalitet. Høydemålingene gir grunnlag for estimat av stående avling. Kalibreringsmålingene skal gjøres før slått er aktuelt. Forløpet av normalkurvene påvirkes ikke av kalibreringsmålingene.
Beregningsrutiner for perioder og stasjoner med manglende data for en eller flere værparametre
Når modellen ikke finner historiske data, enten fordi værstasjonen er satt ut seint på våren, fordi stasjonen ikke måler globalstråling eller fordi tekniske feil har forårsaket hull i datasettet, brukes lagrede væprognosedata som erstatning. For stasjonene Darbu, Hauso, Hesthamar, Loen, Ljøsne, Sandefjord, Slinde, Svelvik syd, Søve og Åsbakken brukes lufttemperatur registrert i frukttrær som estimat for standard lufttemperatur i 2 m høgde.
Kalibrering av modellen
For å kalibrere modellen til lokale forhold knytt til lokalt vær og engtype, kan ein gjere målingar i enga og ta ut prøver til kvalitetsanalyse på eit eller fleire tidspunkt før slått er aktuelt. Ein tilrår slike målingar i perioden frå tidleg til sein stengelstrekking hos graset.
Måling av høgde
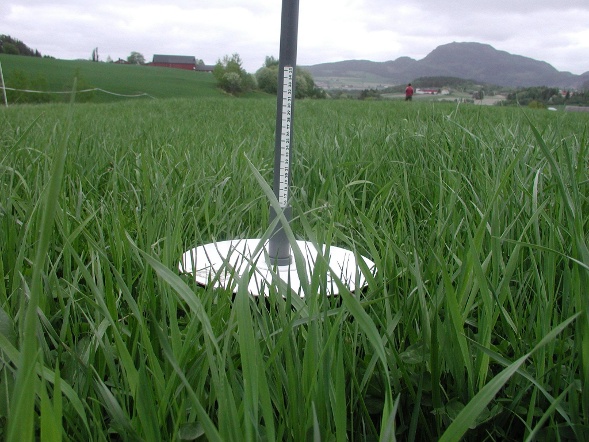
Høgda på bestandet bør målast med platemålar som vist på foto. Ta omtrent 30 enkeltmålingar langs ei tilfeldig valt line på ca 50 m, og legg inn gjennomsnittsverdien (cm) for desse 30 i tabellen for kalibreringsmålingar.
Vurdering av kløverandel
Kløverandelen er %-andelen som kløver blir vurdert eller målt til å utgjøre av tørr avling.
Registrering av fenologisk utviklingstrinn (MSC)
Fenologisk utviklingstrinn blir målt som "Mean stage by count" (MSC) (Bakken et al. 2005). Registreringar skal berre gjerast i vårvekst fram til førsteslått og på skudd klipt ut av den grasarten som dominerer i enga. Det vil oftast vere timotei eller fleirårig raigras.
Uttak av skudd
På tre tilfeldig valde stader innanfor ein radius på 10 m, legg ned ein linjal eller ein blyant og frå eit startpunkt klipp langs denne ned alle skudd av timotei/raigras til du har minimum 20 skudd (60 tilsaman). Det er viktig at ein klipper heilt nede ved basis slik at alle leddknutar og blad blir med. Pass også på at det ikkje blir plukkhausting av dei finaste og største skudda. Hausta skudd blir så klassifiserte (før dei visnar) etter Tabell 1.
Klassifisering av skudd
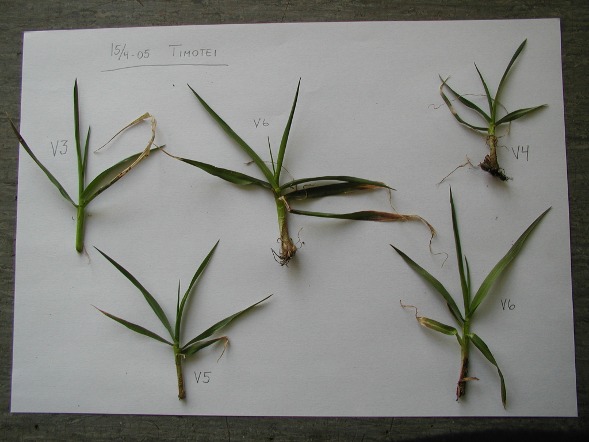
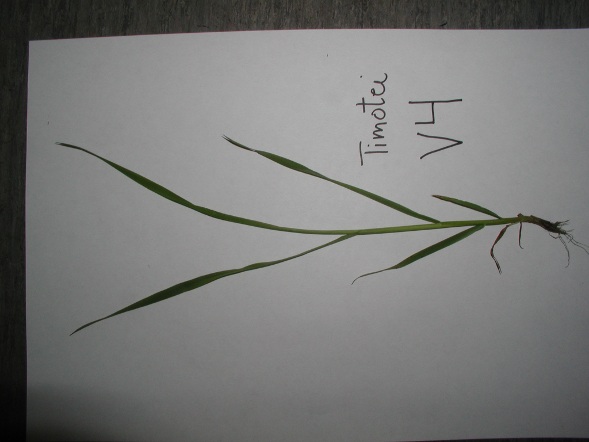
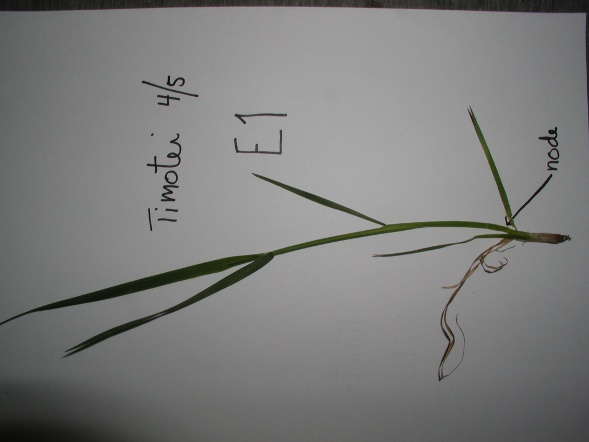
Dei ca 60 skudda blir klassifiserte og sorterte etter dei undertrinna som er lista opp i Tabell 1. Ein reknar så opp kor mange skudd ein har i kvart undertrinn og legg desse tala inn i hjelpetabell for timotei eller raigras.
Eit blad er fullt utkomme enten når slirehinna på det er synleg eller når neste blad (eit yngre eitt) er godt synleg. Det er altså nok at eitt av krava er innfridd. Har eit skudd minst ein node (leddknute), er talet på blad uvesentleg. Har eit skudd nådd det reproduktive stadiet, er talet på nodar (leddknutar) uvesentleg, og skal ikkje reknast opp. Sjå også foto 1, 2 og 3 som illustrasjon/forklaring. Det er ikkje uvanleg å finne timoteiskudd med fleire fullt utvikla blad og fleire nodar enn det som er ført opp i tabellen. Mulege V7 og V8 blir da forenkla rekna for å vere V6, og mulege E5 blir rekna for å vere E4 så sant dei ikkje kan klassifiserast som R0.
Utrekning av MSC
På basis av klassifiseringa og antalet skudd på kvart undertrinn lagt inn i hjelpetabellane, blir det rekna ut ein MSC for gjeldande dato som er grunnlag for kalibrering av modellen si simulering av fenologisk utvikling.
|
Primært utviklingstrinn
|
Undertrinn (Kode) |
|
Beskrivelse |
|
Vegetativt stadium |
|
|
|
|
|
V0 |
|
Første blad synleg |
|
|
V1 |
|
Første blad fullt utkomme |
|
|
V2 |
|
Andre blad fullt utkomme |
|
|
V3 |
|
Tredje blad fullt utkomme |
|
|
V4 |
|
Fjerde blad fullt utkomme |
|
|
V5 |
|
Femte blad fullt utkomme |
|
|
V6 |
|
Sjette blad fullt utkomme |
|
Stengelstrekkingsstadiet |
|
|
|
|
|
E0 |
|
Begynnande stengelstrekking |
|
|
E1 |
|
Første node kjennbar eller synleg |
|
E2 |
|
Andre node kjennbar eller synleg |
|
|
|
E3 |
|
Tredje node kjennbar eller synleg |
|
|
E4 |
|
Fjerde node kjennbar eller synleg |
|
Reproduktivt stadium |
|
|
|
|
|
R0 |
|
Kjenner akset |
|
|
R1 |
|
Begynnande skyting, akset synleg |
|
|
R2 |
|
Akset fullt utkomme |
|
|
R3 |
|
Aksstilk fullt utkomme |
|
|
R4 |
mete
|
Blomstring, synlege pollenberarar |
Uttak av prøver til kvalitetsanalyse og bruk av analyseresultat
Med stubbehøgde ca 5 cm klipper ein ut ein eller fleire prøver på ca 700 g råvekt av plantebestandet i enga og sender til hurtiganalyse på eit laboratorium. Både for å få raske svar og halde kostnadene nede, er NIRS-analyse eit bra alternativ. Laboratoria tar oftast mot både ferske og tørka prøver, og kva ein vil velje her, avheng av tilgang på tørkeskap og kor raskt prøven når fram til laboratoriet. Pass på å velje analysepakkar som gir tal både for innhald av NDF, INDF (ufordøyeleg NDF), råprotein og FEm.
I tabellen for kalibreringsmålingar skal ein legge inn mottatte analyseresultat for NDF (% av TS), INDF (% av TS), råprotein (% av TS) og FEm (per kg TS).
Resultat fra modellkjøringene
Bruker velger aktuelle datoer for førsteslått og seinere i sesongen dato for andreslått som kommer i gjenvekst etter førsteslått. Det kommer da fram estimat for hvor stor avlinga og hvordan fôrkvaliteten vil være på de valgte datoene.
Bidragsytere og finansieringskilder
Modellen er utvikla av NIBIO med finansiering fra Landbruks- og matdepartementet, Avgiftsfondet, Jordbruksavtalepartene, Tine, Felleskjøpet fôrutvikling, Animalia, Yara og Addcon Nordic.
Kontaktperson
Kontakperson i NIBIO er Anne Kjersti Bakken, Divisjon for matproduksjon og samfunn .
